Discover the essential LMS reports you need to measure the impact and ROI of training initiatives.
A study by TalentLMS and SHRM revealed that 76% of workers said they would be more likely to stay with an employer that provides continuous training [1]. This figure highlights just how mission-critical it is for companies to invest in ongoing employee education.
But with such a significant investment, it’s essential that organizations can track the impact of these training initiatives and calculate the ROI. That’s where a learning management system (LMS) comes in.
LMSs not only provide a centralized platform to store and deliver online training, but they also have built-in reporting tools. These LMS reports monitor key training metrics, giving you access to a plethora of learner data.
However, deciphering all the data your LMS provides can be overwhelming. This guide will help L&D teams understand which LMS reports they should generate to track the success and effectiveness of training initiatives.
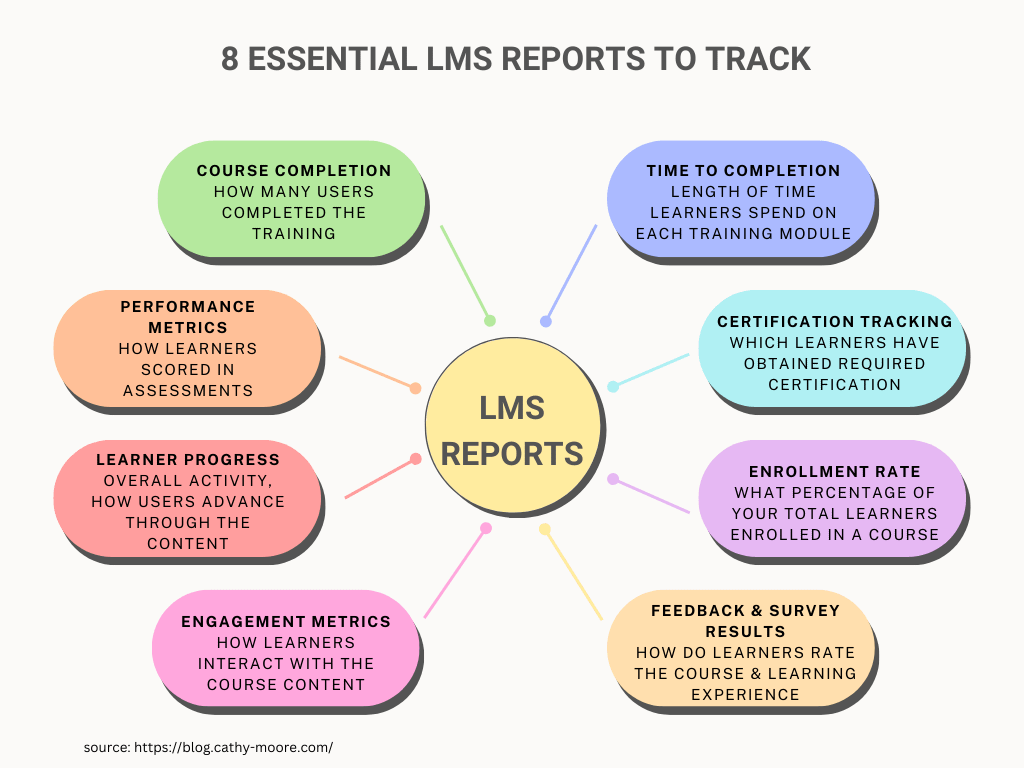
Shortcut: LMS reports to track:
- Course completion rate
- Performance metrics
- Learner progress
- Engagement metrics
- Time to completion
- Certification tracking
- Enrollment rate
- Feedback and survey results
LMS Reporting Explained
LMS reporting collects, analyzes, and presents data about your learners. Using powerful analytics, it can tell you who’s using the learning platform, how they’re using it, and how they’re performing.
This data gives you valuable insights into the effectiveness of training activities in your organization. By monitoring learner progress and course engagement, you can gain a deeper understanding of the overall effectiveness of training and make informed decisions.
Is the training meeting business goals? How is it helping employees solve performance issues?
As a trainer or L&D specialist, you can generate LMS reports to get a broad overview of training activity or deep dive into a specific metric.
What’s more, you can share this data with stakeholders to prove the overall effectiveness of a training program (or illustrate where more attention is needed).
Next up: a quick overview into the importance of LMS reports for your organization.
Benefits of LMS reporting
The benefits of LMS reporting are huge. After all, you can’t improve training programs if you can’t measure your current performance.
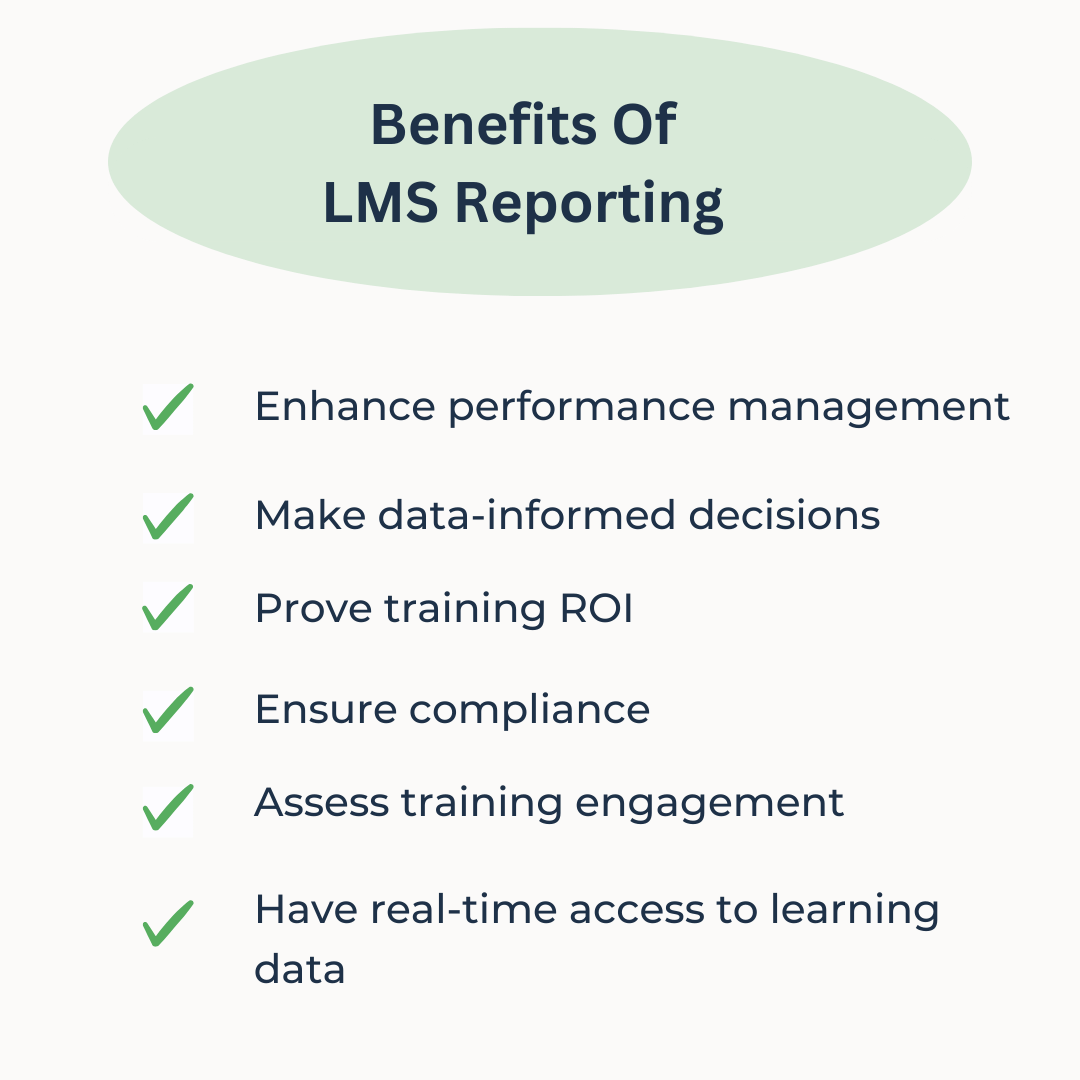
Here are some of the main advantages of LMS reporting for your business:
- Improve performance management workflows – if an employee is not performing, training teams can pull reports to see if they have completed and passed relevant training. Similarly, you can use LMS reports to inform HR about employees who are prioritizing their development.
- Make data-informed decisions – LMS reports highlight areas for improvement, allowing you to allocate time and resources effectively. Moreover, this data allows you to optimize future courses and maximize training efficiency.
- Prove training ROI – you can use LMS reports to calculate how cost-effective training is and how well it has contributed to the associated business goal.
- Ensure compliance – completion reports make it easy to ensure that all employees have completed mandatory courses. This is essential for compliance training.
- Assess training engagement – you can track engagement metrics to see how well the training resonates with learners.
- Real-time access to learning data – managers can generate real-time LMS reports to stay up-to-date with employee progress and keep that data on hand.
Now, let’s take a closer look at the key LMS reports you should review at least once a week.
Key LMS reports you need to optimize your training programs
Having an LMS with powerful analytics means you have a world of information at your fingertips. But what are the key metrics you should be focusing on?
These LMS reports cover the critical data your team needs to measure training effectiveness and maximize your employee education programs.
Disclaimer: Different LMSs will call these reports by different names. As such, the titles we’ve used explain the general data the report covers and may not coincide with the exact report name in your LMS of choice.
1. Course completion rate
What it is:
The course completion rate measures the percentage of learners who successfully finish a training course within a set timeframe.
What it tells you:
This metric tells you how many learners successfully completed the course and gives you an idea of how engaging the course is.
For instance, high completion rates suggest the course was engaging and easy to understand. Conversely, a low completion rate could indicate that the course was hard to follow or unengaging.
Measuring course completion rates allows you to see where learners drop off. For example, if most learners drop out during a specific module or exercise, it’s a clear sign something needs to improve. Perhaps it’s too difficult, or maybe it’s not engaging enough.
Having a documented record of completion rates is a legal requirement for many compliance training programs. Therefore, this is a crucial metric to monitor.
Actions to take:
Try these strategies to boost course completion rates:
- Offer learners incentives for completing courses
- Break long training courses into short microlearning modules
- Ensure content is interactive and adds real-world value
- Provide extra resources to support learners
- Highlight why the training will benefit learners
2. Performance metrics
What it is:
Performance metrics, such as assessment results, indicate how learners score in quizzes, exams, and other practical assignments in your LMS. Some LMSs will also offer reports that break down how learners answered each quiz question. That way, you can understand where knowledge gaps may lie.
What it tells you:
Performance metrics show you how well learners understand and retain the course content. They also help you identify knowledge gaps and intervene quickly.
Let’s say that the average assessment score is 50%.
This could indicate that the material is missing information, is unclear, or that the assessment is too difficult. Alternatively, it may indicate that the audience lacks motivation.
Are your learners simply clicking through each slide without taking the information in?
On the contrary, if everybody is scoring 100%, there’s a high possibility that the learning materials (or the assessment questions) are too easy.
Access to this information allows you to refine your content, pinpoint where further instruction is needed, and ensure the training is suitable for the audience.
Finally, you can use performance metrics to identify top talent. Who’s consistently excelling? They may be potential mentors or peer coaches.
Actions to take:
Try these simple steps to improve overall assessment scores:
- Break complex topics into short, simple terms
- Offer immediate feedback
- Use real-world examples and workplace scenarios to engage learners
- Ensure quiz questions are clearly worded
- Use a variety of evaluation styles (multiple choice, ordering sequences, writing tasks etc)
- Space knowledge check exercises throughout the training to ensure learners are keeping up
3. Learner progress
What it is:
Learner progress reports track how individual learners or groups advance through a course. This gives you a clear idea of where people are on their learning journey and a comprehensive overview of organizational training activities.
What it tells you:
This metric offers you a real-time snapshot of how learners are progressing through the training program. That allows you to give progress updates to management or HR, chase up learners who are falling behind, and identify where learners are struggling.
This is particularly beneficial during onboarding, as it gives you the opportunity to identify and address pinpoints early.
You can also use this report to look for signs that the course content is well-structured and engaging or if it needs improvement.
Actions to take:
Try these action steps if you notice learner progress is low:
- Review the training material to ensure it’s engaging and relevant
- Gather feedback from employees to see why they’re struggling
- Provide additional resources to support learners
- Underscore how the training impacts the business
- Collaborate with managers to promote the training and highlight its importance
- Create personalized learning plans to motivate and empower employees
4. Engagement metrics
What it is:
Engagement metrics indicate how much learners interact with the course content, activities, and discussions (if your LMS supports forums or discussion boards). These metrics include the time spent on each module, how often they log into the course, and course ratings.
They also include how learners interact with other gamification and social learning initiatives, such as leaderboards and knowledge sharing.
What it tells you:
This data gives you insight into how effective the learning experience is. High engagement rates indicate that learners are actively participating in the training.
On the other hand, low engagement rates suggest your training needs more interactive elements or opportunities for learner participation.
This type of LMS report allows you to hone in on specific modules to see where learners engage most and least. That way, you can refine this module to optimize the learning experience.
Actions to take:
These strategies can help you improve learner engagement:
- Incorporate discussion forums and other social learning opportunities for learners to interact
- Provide interactive content in a variety of formats (video, images, audio, text)
- Gamify the learning experience with badges, leaderboards, and other incentives
- Encourage learners to ask questions and share their feedback
- Include real-world simulations and practical activities that mirror on-the-job scenarios
5. Time to completion
What it is:
One critical LMS report you should be checking is how long learners take to finish an activity, module, or course. This gives you an idea of the average time users spend on the course.
What it tells you:
Tracking the time spent on each module in a course can help you gauge the overall efficiency of the training materials.
You may notice that learners are whizzing through one section of the course. That could be an indicator that the material isn’t challenging enough. Alternatively, it may be an indicator that you need to include more interactive activities in this section to encourage learners to participate more.
Conversely, if learners spend much longer on a particular module, it may be too challenging. Can you break this information down into easy-to-digest chunks? Are the activities too time-consuming? Is the content missing vital information? These are signs that you need to do some further investigating.
There’s another reason why this LMS report is important. It allows you to gauge how accurate your time estimations are.
Suppose you planned to create a twenty-minute micro course, but it’s taking learners forty minutes. This is a big red flag that you should address right away.
The likelihood is that you’ve crammed too much in and need to go back and edit the content (or divide it into smaller sections). If not, you run the risk of learners losing interest and dropping out.
Actions to take:
Here are some strategies that can help reduce the time to completion:
- Drip-feed learners materials to avoid overwhelming them
- Break long content down into smaller pills (around 10–20 minutes is ideal)
- Spread interactive activities out across the course
- Cover one topic per module to avoid cramming too much content in
- Encourage learners to participate actively by including practical activities
- Enhance the efficiency of training materials by ensuring they are clear and easy to follow
6. Certification tracking
What it is:
Certification management reports show which learners have completed the required mandatory training (and obtained a certificate). This is one of the most essential LMS reports if your organization is in an industry with strict compliance standards.
What it tells you:
This report tells you which employees have the necessary certificates and who needs to complete or repeat compliance training.
Your organization may need to provide this as evidence in the case of an audit or incident.
The certification report makes it easy to spot employees who still need to complete the necessary compliance training or who scored low.
That way, you can intervene before an incident occurs.
Most LMSs allow you to set up automatic reminders, letting employees know they must complete compliance training. This saves a lot of valuable time for busy HR and L&D teams.
This is especially important if an employee is promoted or moves to a new department and must complete additional compliance training. These cases can easily slip through the cracks without proper care.
Actions to take:
These strategies can help you ensure that all employees obtain the necessary certifications:
- Offer incentives for employees who successfully complete compliance training
- Outline the importance of having all the required certification
- Encourage learners to share their certifications on social media
- Collaborate with managers to chase up employees who are falling behind
- Set up automatic reminders and deadline notifications on your LMS
- Encourage employees to take accountability for obtaining all relevant certifications
7. Enrollment rate
What it is:
The enrollment rate measures how many learners have enrolled in a specific course or program (elective courses only). It shows what percentage of your total learners have enrolled, revealing how popular the training is or how valuable employees perceive it to be.
What it tells you:
This LMS report shows you how interested your learners are in a given course. If enrollment rates are high, this is usually a sign that you’ve marketed the training well and the topic is appealing to your audience.
This is likely a topic that employees consider valuable for their professional development. It also allows you to gain insight into which employees are taking initiative and prioritising learning.
On the flip side, low enrollments suggest some issues. This may be a hint that you need a better promotional strategy or a higher-converting course description.
On a deeper level, it may indicate that employees don’t see the relevance or value of this course.
Low enrollment rates could also be a sign that learners don’t find the course engaging. In this case, you may want to look at learner reviews and feedback to assess the main issues.
Actions to take:
There are a few ways to improve enrollment rates. These include:
- Create a strong PR campaign to promote training courses
- Offer incentives like badges and certificates for completing training programs
- Highlight how the program will enable learners to reach their professional goals
- Gather feedback to understand pain points and optimize the course
- Write an engaging and high-converting course description
- Make sure the course topic aligns with business goals
8. Feedback and survey results
What it is:
LMS reports that capture learner feedback and survey results show the overall user experience.
In short, they do this by indicating the aspects of the training that resonate with learners and the parts that need work.
What it tells you:
This LMS report gives qualitative insights into how satisfied your learners are. In turn, this allows you to make informed decisions about how to improve the course.
LMS reports offer a quick and visual way to get an overview of learners’ sentiments. But it’s important to write clear survey questions.
Think about the core insights you want to get from learners. Here are some ideas:
- How valuable do learners find the course?
- Did the training meet their expectations?
- Has the training improved the learner’s on-the-job performance?
- Is the course content clear and easy to follow?
- Does the learner feel engaged during the training course?
- Did the learner have enough opportunities to apply their knowledge?
- How can you improve the training?
- How likely are learners to recommend this training to a friend?
Actions to take:
- The danger with long feedback surveys is that people skip them. So, start small.
- Ask learners to leave their feedback in the comments section and rate the course.
- You may also want to add one simple question on the last page of the course, such as the net promoter score (NPS).
- Then, you can conduct more in-depth feedback based on these results or reach out to individual learners for more information.
Boost training ROI today!
LMS reports allow you to measure the impact of training initiatives without hours of manual labor. With real-time access to data and a visually appealing dashboard, it’s the easiest way to measure training ROI.
That said, it’s crucial to understand which metrics you should track.
These key LMS reports cover all the fundamental information you need to optimize your training programs and enhance the learning experience.
What is your go-to LMS report for measuring the effectiveness of employee training? Comment below. Want to learn more? Get better training outcomes with the Scenario design toolkit.

By Nicola Wylie
Nicola Wylie is a learning industry expert who loves sharing in-depth insights into the latest trends, challenges, and technologies.